
Hardware Innovation
Standalone Hands-Free Solutions
Discover how standalone Android smart glasses improve productivity across industrial environments.
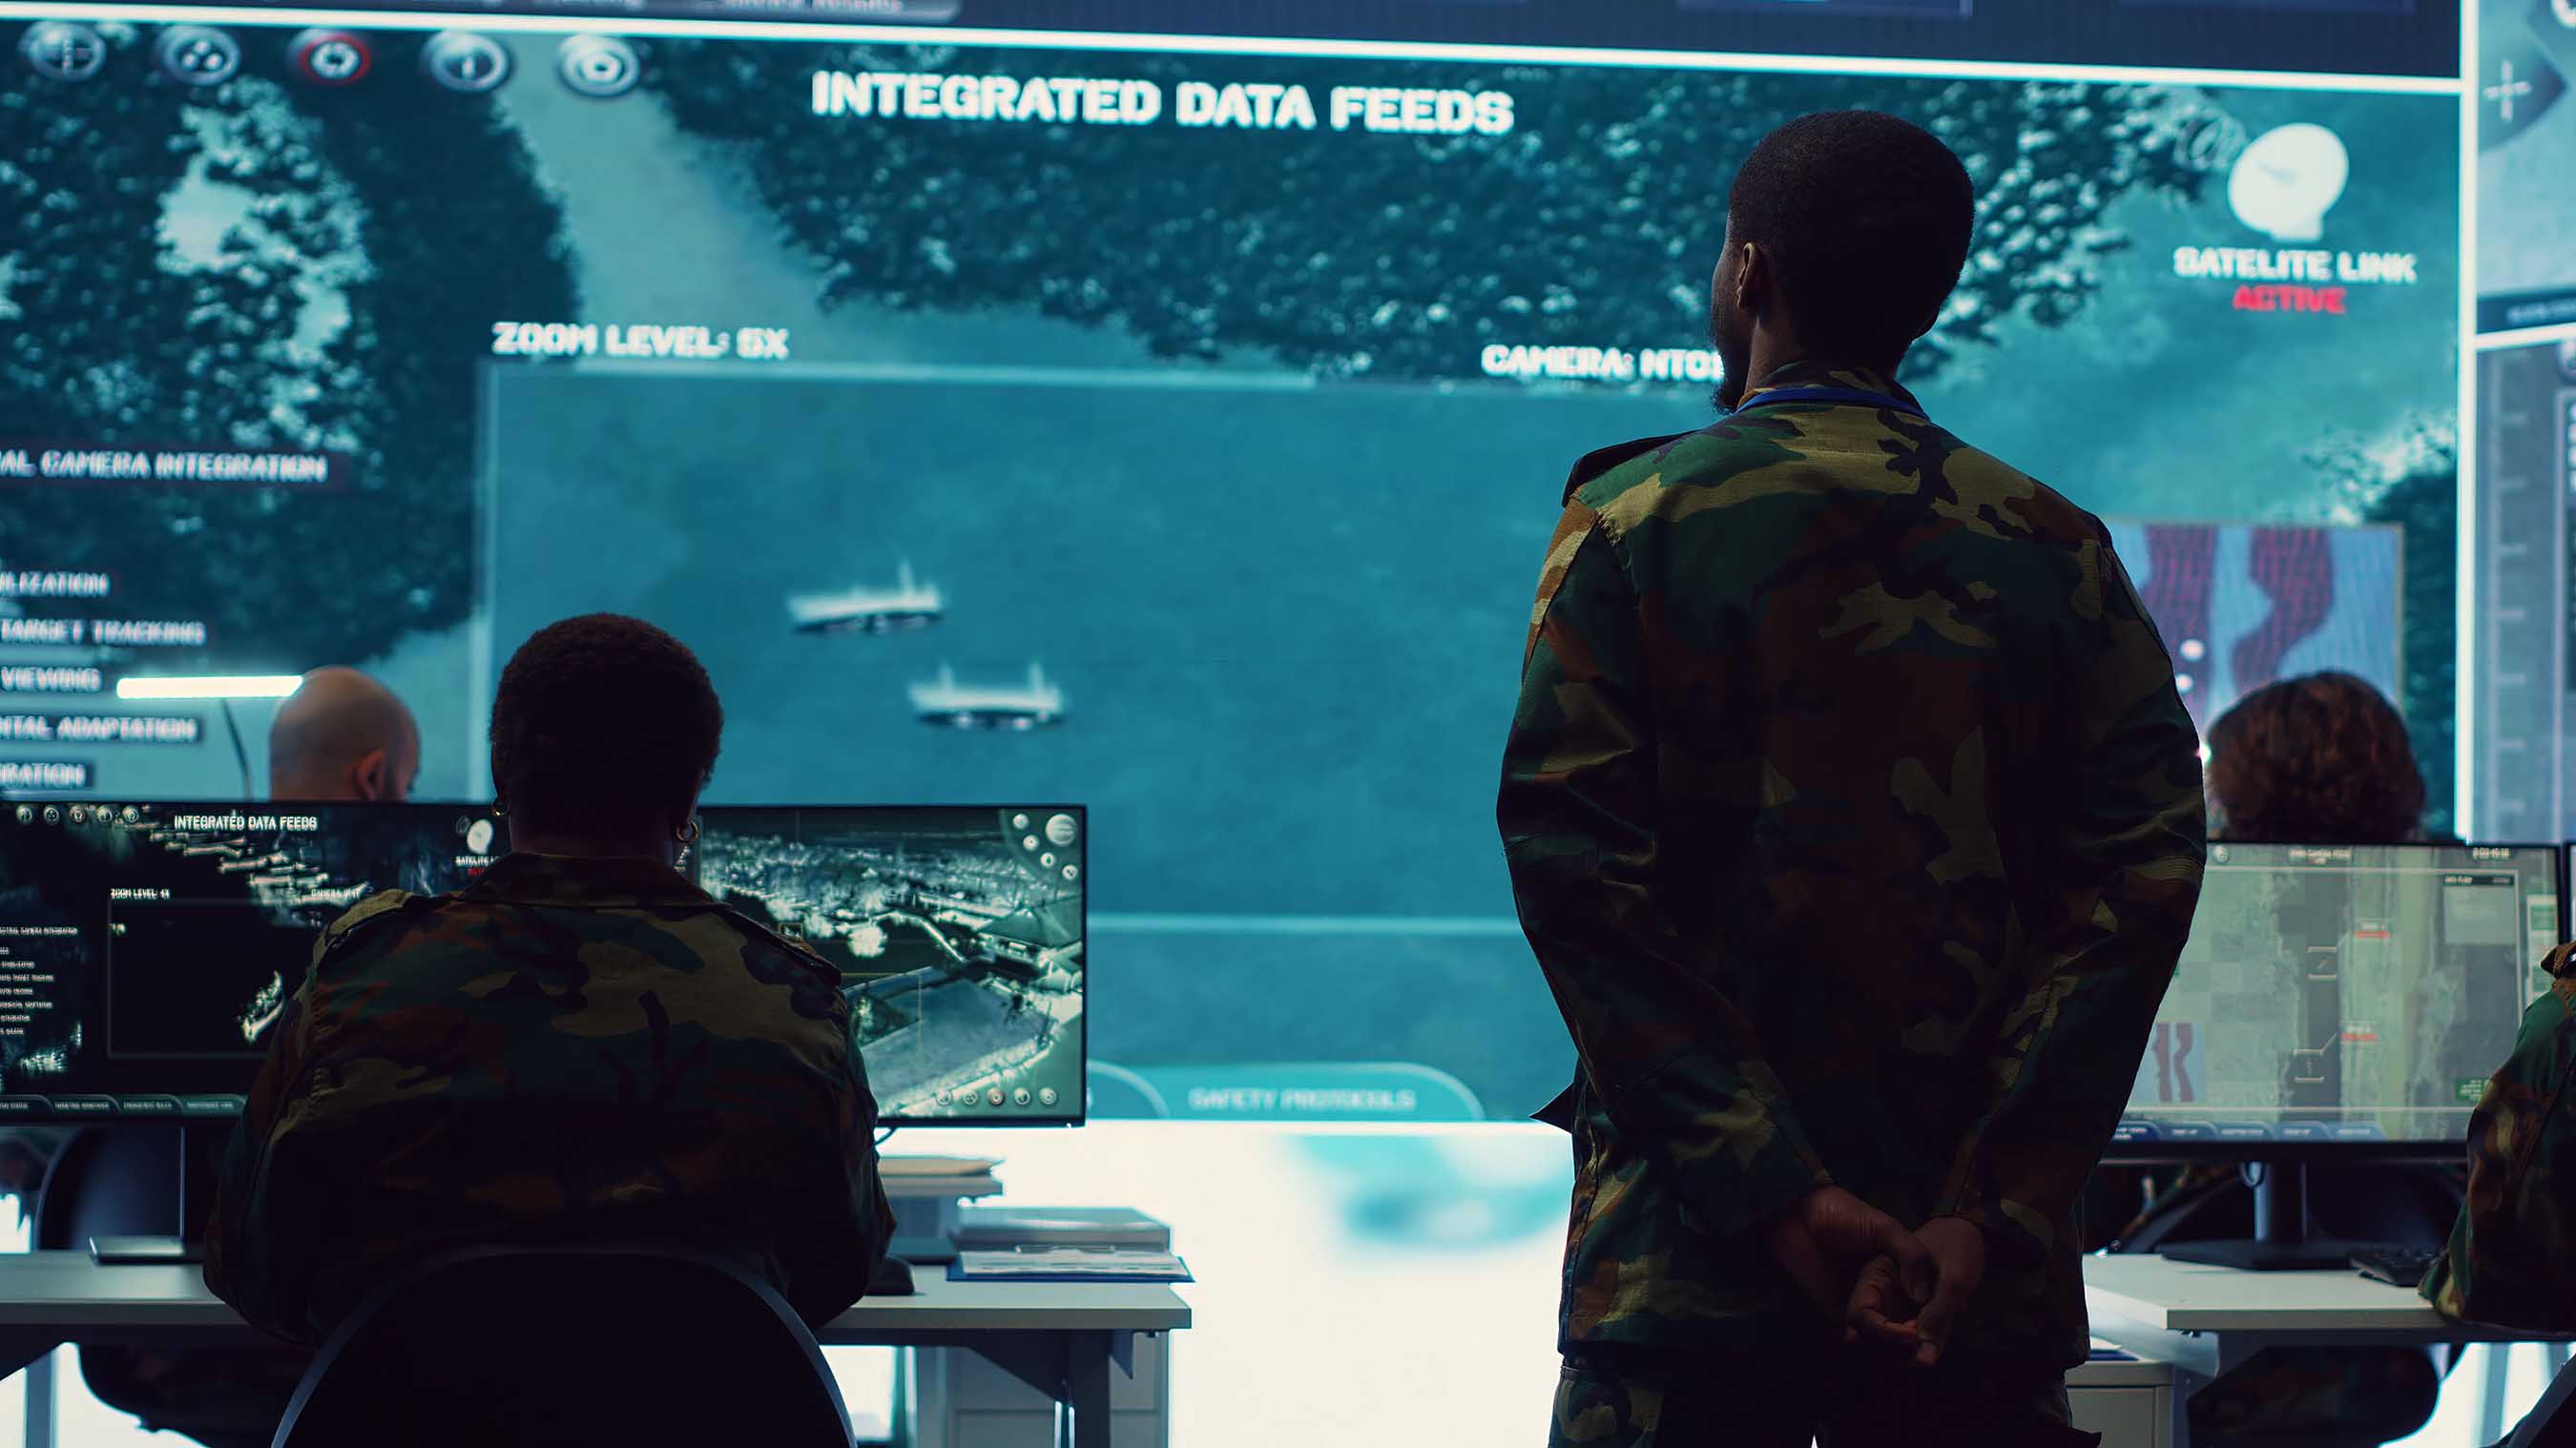
Command Center
Real-Time Field Intelligence
Live video feeds, telemetry, and central monitoring for multi-operator teams.
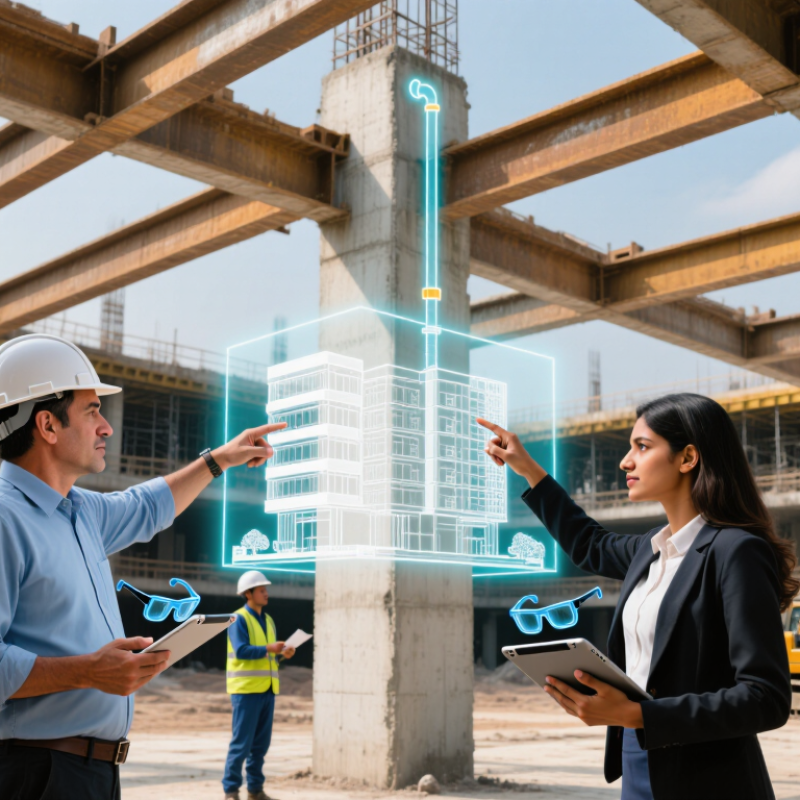
Choosing a provider for AEC AR Construction Visualization is not just a software decision. It affects how teams review designs, coordinate trades, and explain changes on site. A model viewed through a tablet beside a concrete column can reveal clashes that are easy to miss on a screen. Yet a convincing overlay is not proof of accurate construction data.
Apple CEO Tim Cook, a prominent voice on augmented reality, once said, “I think AR is a profound technology that will affect everything.” In architecture, engineering, and construction, that promise depends on practical details: model alignment, device support, data workflows, and reliable performance in changing site conditions. The best platform for a design review may not suit field coordination. Fit matters.
This guide compares leading providers by their visualization capabilities, collaboration tools, implementation needs, and suitability for different project teams. It also considers how clearly each provider explains limitations, integrations, and ongoing support. Buyers should ask to test real project models, not polished demonstrations alone. Check alignment in a busy room. Test it outdoors, too. No ranking is perfect; provider features and project requirements change. Treat this comparison as a starting point, then verify claims against your own workflows, devices, and project data.
McKinsey’s 13% Global GDP Estimate: Why AEC Visualization Matters
Construction is often estimated to generate about 13% of global GDP, making the built environment a major economic force. The figure is broad, not a precise measure of every design or construction activity. Still, it shows why small project decisions can carry large financial consequences. A misplaced doorway in a digital model may seem minor. Repeated across drawings and construction teams, however, unclear information can create costly revisions.
Architectural, engineering, and construction visualization helps teams examine spaces before they are built. A realistic model can reveal awkward sightlines, tight circulation, or clashes between building systems. It also gives clients a clearer way to respond than technical drawings alone. Better visualization does not guarantee a better project. Poor assumptions can look convincing on screen, and that is a real risk. Providers should explain how they manage model accuracy, design changes, and review feedback—not just show polished images.
Tips: Ask for a sample tied to your project type. Check whether materials, lighting, and dimensions match the design information. Request clear revision steps and named deliverables. Compare practical detail, not only visual drama. And leave room for doubt: a beautiful image cannot replace careful technical review.
| Industry Indicator | Reported Figure | Scope and Period | Relevance to AEC Visualization | Source |
|---|---|---|---|---|
| Construction’s contribution to global GDP | Approximately 13% | Global construction industry estimate reported in 2017 | Shows the economic scale of the sector and the potential importance of clear project communication across design, construction, and operations. | 2017 global construction productivity analysis |
| Construction labor-productivity growth | About 1% per year | Global construction, average annual growth from 1995 to 2015 | Highlights a long-running productivity challenge. Model-based visualization can help teams review design intent and coordinate information, but does not by itself guarantee productivity gains. | 2017 global construction productivity analysis |
| Labor-productivity growth across the global economy | About 2.8% per year | Global economy, average annual growth from 1995 to 2015 | Provides a comparison benchmark for the construction-sector productivity figure in the same analysis. | 2017 global construction productivity analysis |
| Manufacturing labor-productivity growth | About 3.6% per year | Global manufacturing, average annual growth from 1995 to 2015 | Offers a second benchmark for understanding the productivity gap discussed in construction research. | 2017 global construction productivity analysis |
| Buildings and construction share of global final energy use | 36% | Global estimate reported for 2018 | Supports the use of visualization to communicate building design, energy-related decisions, and project information to stakeholders. | 2019 Global Status Report for Buildings and Construction |
| Buildings and construction share of energy-related CO₂ emissions | 39% | Global estimate reported for 2018 | Illustrates the sector’s environmental significance. Visualization can make design options and sustainability information easier to inspect; the figure is not an estimate of visualization’s emissions impact. | 2019 Global Status Report for Buildings and Construction |
Note: Figures are sector-level estimates from the cited publications, not measurements of any individual provider or visualization product. The productivity figures refer to labor productivity.
FAQS
Construction is estimated to generate about 13% of global GDP. The figure is broad, not a precise measure. A misplaced doorway can trigger repeated drawing changes and costly site revisions.
It can show awkward sightlines, tight corridors, and clashes between pipes or other building systems. Clients can also respond to a realistic space more easily than to technical drawings alone.
Mobile AR can help supervisors compare pipe routes on a tablet with installations on a concrete wall. Headsets allow hands-free inspections, but long shifts may make them uncomfortable. Useful in the field.
Overlay the same floor plan, column grid, and service routes on a real project area. Check alignment at corners and narrow corridors, under ordinary lighting. Small errors matter.
Confirm the system works with existing design files, issue tracking, and model updates. Test setup time, crew training, device coverage, and support. Ask what happens when site connectivity drops.
Track time spent resolving clashes, reviewing changes, and briefing crews, along with avoided rework. A short pilot offers better evidence than a polished demonstration, though it may miss seasonal site changes.
Poor assumptions may look accurate on screen. Delayed model updates can also leave field teams viewing outdated information. A neat demo can fool us.
Request a sample tied to the project type, clear revision steps, and named deliverables. Check dimensions, materials, and lighting against design information. I might still give too much weight to visual detail.
Conclusion
AEC AR Construction Visualization is becoming an important way to connect design information with on-site decisions. With the built environment representing a substantial share of global economic activity and construction productivity growth remaining modest, augmented reality can help teams review designs in context, identify coordination issues earlier, and communicate changes more clearly. Its value depends on more than visual impact: project information must remain accurate, accessible, and useful throughout planning and construction.
In China, providers can be compared by the platforms they support and the work they enable, such as BIM model viewing, site coordination, installation guidance, or client presentations. Effective solutions should interoperate with common BIM workflows, including IFC 4.3 and ISO 19650-aligned information management. Evaluation should consider model accuracy, integration with existing tools, deployment requirements, user adoption, and measurable return on investment. A well-matched AR workflow can reduce information gaps and support more consistent project delivery.